- Trend - Up Trend
- Momentum - Overbought
- Support - 2.66
Resistance - 2.86 - Volume -0.5x
- Candlestick - Doji (indecisive)
Dear viewers, I am moving from blogspot "ckhpaul.com" platform to another membership platform known as "Geckochart.com". It's free as promised - if you like this blog. Do follow me to the new site, as I will be featuring more screeners and SGX announcement to ensure that we made little money for our investment. Please registered as FREE "Regular Member", to see more information or SGX/HSI/Currency screeners.
Menu
WE HAVE MOVED TO GECKOCHART.COM (Join us there, It's FREE)
WE HAD MOVED TO GECKOCHART.COM. IN 2012, YOU WILL SEE MORE ADVANCE SIGNALS AT THE BLOG SITE
LIVE Chat - Stocks Signal Tips Board
30/8/11
Aug 31, TA for Starhub
Aug 31, TA for StarHub,
Labels:
Starhub
TA for SSE (Shanghai)
Wave For Shanghai SE,
In my blog, I try to give you another prospective on traditional charting on Wave theory. As mentioned before, highly subjective and depends on which school of taught that you have learned and apply. In my blog, I research more on Main Wave Theory (which was generalised by all Wave experts) and I incorporated Fibonacci Retracement for the guidance of Main Wave Movement and Retracement movement.
In my week update (requested by viewer), I update the Wave for Shanghai SE index. Where is the Wave direction? 12345 or ABC?
Clearly, it is in Wave 2 (upward trending) but hitting the Support (half way - retracement line of 78.5% or 2574 support). It is definitely not like those of HSI and S&P 500 (downward - Wave B) movement.
In Wave theory, downtrending wave formation is fast and furious. Upward is an long, slow and uphill task.
Labels:
Wave Theory
28/8/11
Aug 29. TA for STI
TA for STI
- Trend - DownTrend
- Momentum - Oversold
- Support - 2720
- Resistance - 2780
- Candlestick - Doji (indecisive)
- Volume - 0.5x
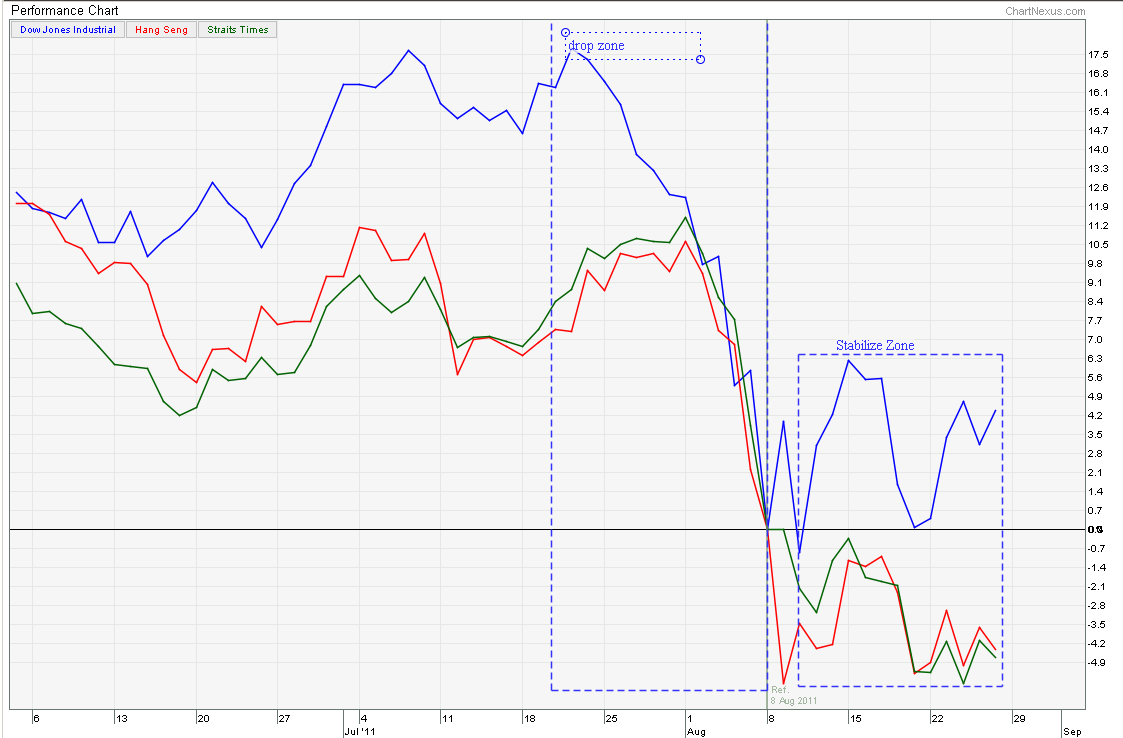
An excessive selling will drain the Bear energy, and now we are in the stabilize zone. From the daily STI index, we are in the narrow range of 2720 and 2780. Each Candlestick tends to cancel off each other, making trading volatility high and unpredictable (eg, Black Engulfing (Bear)-> White Harami (Bull) -> Doji (Indecisive).
From TA prospective, Bear is out of steam is confirmed with last weekly chart. The week volume is closed with a positive Green Volume (Above 50D average) and stabilizing. These signs increase the probability of a Good Entry for Stocks or Value Hunting.
Using TA Stocks Screener - For Good stocks tend to be in Side or Up Trend.
Using FA Stocks Screener - Selection of Value stocks - you can used the Stocks Screeners (as your selection). FA Stocks Screener - Choose those with either Green PE trailing or discounted NAV.
Labels:
STI
25/8/11
Aug25, TA for KeyCorp
25 Aug, TA for KeyCorp
- Trend - Down
- Momentum - Oversold
- Support - 8.80 (Gap Down Resistance)
- Resistance - 8.40
- Candlestick - Black Marubozu
- Volume - 2x Selling Pressure
Sembcorp, SembMar, KeyCorp are now in downtrend industry cycle. It is important that you look at the data provided by DBS Vicker highlighting the downtrend industry, so it is important that 8.40 support must not be broken, else it really signal continuous downtrend.
Labels:
KepCorp
21/8/11
Aug 22, FA/TA for Transpac
Simple FA for Transpac,
Transpac is Financial Asset Management paying out unbelieveable $0.41/share. It is similar to those Unit Trust Fund - in a layman word. Looking at the Annual report, Profit before tax is S$61,658k and Dividend payout is 0.41(Dividend payout as of 2010) x175,228k (Total Ordinary Shares) = S$71,843,480. So they payout more than what they earned? Personally, my opinion is "This is a high risk high return stock".
TA for Transpac,
This Transpac is on upward trend, and good entry should be at 1.63. (*but do note the downside risk on the fundamental valuation).
- - PE - 4.9X ( if compared against EV/EBITDA 4.33, it is not at Fair PE).
- - NAV - $0.99 (50% above premium)
- - Yield - $0.41/Share or 25% (extremely high yield)
Transpac is Financial Asset Management paying out unbelieveable $0.41/share. It is similar to those Unit Trust Fund - in a layman word. Looking at the Annual report, Profit before tax is S$61,658k and Dividend payout is 0.41(Dividend payout as of 2010) x175,228k (Total Ordinary Shares) = S$71,843,480. So they payout more than what they earned? Personally, my opinion is "This is a high risk high return stock".
TA for Transpac,
- Trend - Up
- Momentum - Overbought
- Support - 1.63 (good entry)
- Resistance - 1.97
This Transpac is on upward trend, and good entry should be at 1.63. (*but do note the downside risk on the fundamental valuation).
Labels:
Transpac
Aug 22, TA/FA for Wilmar
Yahoo Key Statistic - reveals Wilma
Intrinsic Value of Wilmar, using DDM and Graham Formula reveals, Wilmar Intrinsic Value at
EV/EBITDA calculation shows Fair PE at 14.5x.
I am using 2x financial data to verify some data from Shareinvestor.com and Yahoo-Capital IQ.
From Simple FA -
- PE 18.8, it is still not at Fair PE
- NAV $2.38 - still not a discounted NAV
- Yield at 1.093 (low PE)
From Intermediate FA -
Intrinsic Value of Wilmar at 5.60-5.69 max
Conclusion for FA-Wilmar,
It is not a value stock for long.
Aug 22, TA for Wilmar
My opinion on Wilmar has signs of bullish with Candlestick, Momentum Oversold, at Classical Resistance and Volume decreasing (It shows seller is resistance to sell much lower.) Yes, it is a good entry near 5.
- At Fair PE,
- PEG at 0.5.
Intrinsic Value of Wilmar, using DDM and Graham Formula reveals, Wilmar Intrinsic Value at
- DDM - 3.11-5.60
- Graham - 4.68 - 5.69
EV/EBITDA calculation shows Fair PE at 14.5x.
I am using 2x financial data to verify some data from Shareinvestor.com and Yahoo-Capital IQ.
From Simple FA -
- PE 18.8, it is still not at Fair PE
- NAV $2.38 - still not a discounted NAV
- Yield at 1.093 (low PE)
From Intermediate FA -
Intrinsic Value of Wilmar at 5.60-5.69 max
Conclusion for FA-Wilmar,
It is not a value stock for long.
Aug 22, TA for Wilmar
- Trend - Side
- Momentum - Oversold
- Support 5.00 (Good Entry)
- Resistance 5.92
- Candlestick - Inverted Hammer (Bullish Reversal Signal)
- Volume - 0.5x of Average (Selling Pressure is less, shows sign of Bullish reversal.)
My opinion on Wilmar has signs of bullish with Candlestick, Momentum Oversold, at Classical Resistance and Volume decreasing (It shows seller is resistance to sell much lower.) Yes, it is a good entry near 5.
Labels:
Wilmar
20/8/11
TA for STI - Is the Bear still full of energy?
Is the bear losing it energy? Is it time for Long?
In my blog, I have been trying to analysis and trace Wave Movement and Fibonacci Retracement for our reference. Volume Analysis is an important aspect of determining the strength of the Bear Movement. Traditional Technical Indicators are lagging signal, it will only indicate to you a signal that is 1-2 days late.
For the last few weeks, I was pessimistic about the STI index as it exhibited negative signal. But now, looking back and analysis the Volume for the past 3 weeks - indicate that there is a high probability of a technical rebound of we might be near to our Bear Season.
Why I say so?
In every near-end of Bear Market, there will be a Surge + Peak on Selling Volume. You don't usually see such signal very often - I would say "Once in a BLUE moon". Breaking a Fibonacci resistance would need a Strong Sell Volume, it's not like a typical classical resistance where no volume could break it. The further it goes, the more the Surge Selling Volume will need to be generated. If the volume is only slightly above Weekly Average, the Bear is still very much in control. Thereby, entry is not that recommended.
Will the Volume indicators show us otherwise?
Yes, but it is at low probability, if you look at DJI at Oct,Nov 2008 and Feb 2009, the market is trying to push the index very low, but the Support is extremely strong and then on Feb 2009, a Very Strong Rebound occurred - that was the start of another Bull Run.
What will be the STI Support level?
- It should be at 2680. An average down strategy might be useful for fundamentalist, try only average down entry at next Fibo support - 2240.
Labels:
STI
Subscribe to:
Posts (Atom)