Menu

WE HAVE MOVED TO GECKOCHART.COM (Join us there, It's FREE)

WE HAD MOVED TO GECKOCHART.COM. IN 2012, YOU WILL SEE MORE ADVANCE SIGNALS AT THE BLOG SITE

LIVE Chat - Stocks Signal Tips Board

30/8/11

Aug 31, FA Stocks Screener


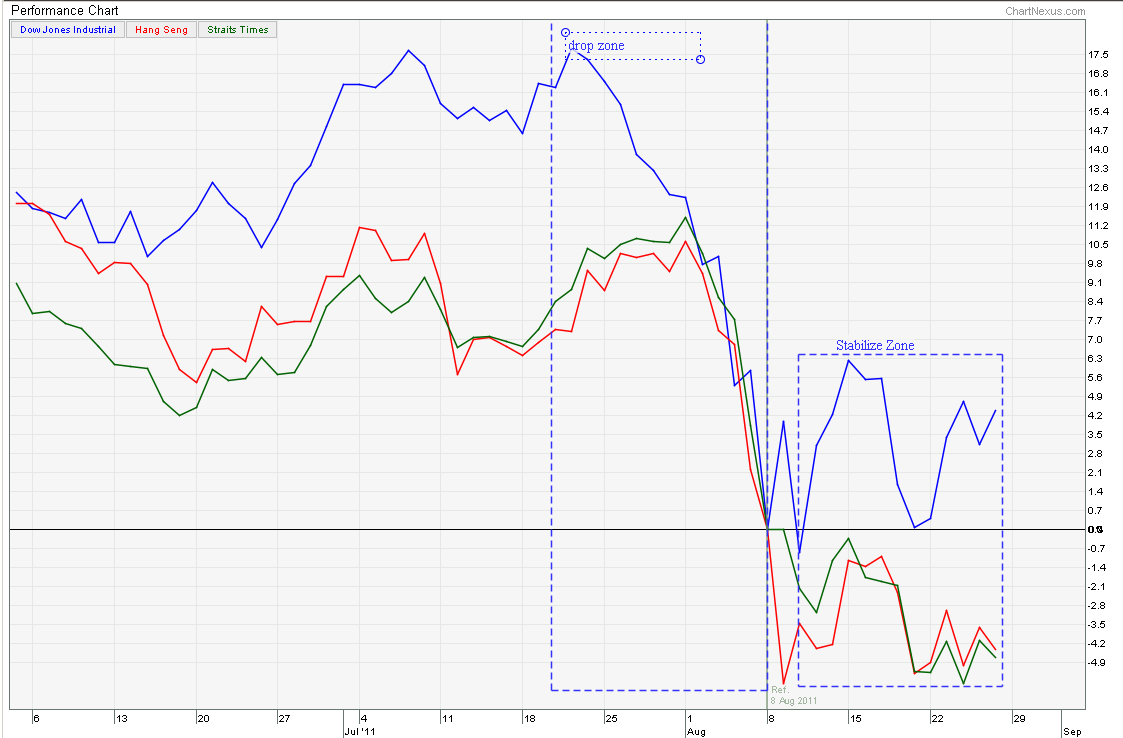
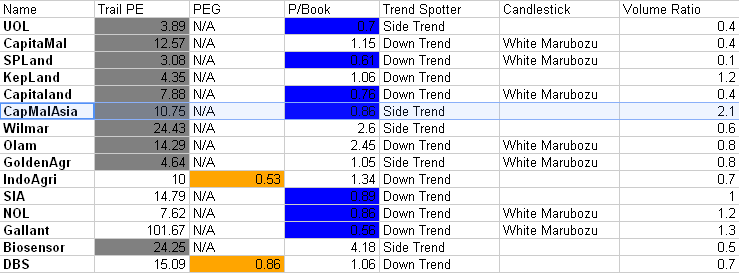
As mentioned before, there should be a technical rebound and possible a start of reversal trend. For fundamentalist, these are the lists of stocks that you should start to park some of your investment into them.

How to read Colour Code?
- Grey - represents Below PE ratio compare to EV/EBITDA
- Orange - represents PEG < 1 means a good entry
- Blue - represents Price trading below discounted book value.

When to Enter?
- For Moderate Risk Entry, a good entry is when the Stocks Price have stabilised or in Side Trend.
- To follow simple TA entry is when Volume Ratio > 1.3 and Candlestick Momentum is WHITE.

These stocks list provided you some minimum safety nets for investment. For Chartist, these should be your watch list to Long up until the resistance level is reached.

TA for CapMallAsia


  • Trend - downtrend but possible a Trend Changing is happening.
    Momentum - Overbought
  • Support - 1.14
  • Resistance - 1.41
  • Volume - Average
  • Candlestick - 3 white soldiers. 

From FA prospective, from my FA stocks Screener - CapMallAsia is at below PE ratio (compare to EV/EBITDA) and below Price to Book of 0.86. With TA momentum is gaining up, this stock should be one of your Value Investing Position.
 

Aug 31, TA for Starhub

Aug 31, TA for StarHub,

  • Trend - Up Trend
  • Momentum - Overbought
  • Support - 2.66
    Resistance - 2.86
  • Volume -0.5x 
  • Candlestick - Doji (indecisive)
While the rest of the stocks are struggling to turn uptrend, Starhub is the first few popular stocks that recovered from the rest. It is now hitting the resistance level of 2.86, but it is also forming a bullish Flag Up Pattern. This stock should be in your radar if it breaks 2.86, it will turn resistance to support. 


TA for SSE (Shanghai)


Wave For Shanghai SE,

In my blog, I try to give you another prospective on traditional charting on Wave theory. As mentioned before, highly subjective and depends on which school of taught that you have learned and apply. In my blog, I research more on Main Wave Theory (which was generalised by all Wave experts) and I incorporated Fibonacci Retracement for the guidance of Main Wave Movement and Retracement movement.

In my week update (requested by viewer), I update the Wave for Shanghai SE index. Where is the Wave direction? 12345 or ABC?

Clearly, it is in Wave 2 (upward trending) but hitting the Support (half way - retracement line of 78.5% or 2574 support). It is definitely not like those of HSI and S&P 500 (downward - Wave B) movement.

In Wave theory, downtrending wave formation is fast and furious. Upward is an long, slow and uphill task.  


28/8/11

Aug 29. TA for STI


TA for STI
  • Trend - DownTrend
  • Momentum - Oversold
  • Support - 2720
  • Resistance - 2780
  • Candlestick - Doji (indecisive)
  • Volume - 0.5x
 For the past 3 weeks, the selling pressure was great and I mentioned that the Bear might be running out of steam. Looking at last week momentum and signals, it was pretty much a confirmation of the data movement.
An excessive selling will drain the Bear energy, and now we are in the stabilize zone. From the daily STI index, we are in the narrow range of 2720 and 2780. Each Candlestick tends to cancel off each other, making trading volatility high and unpredictable (eg, Black Engulfing (Bear)-> White Harami (Bull) -> Doji (Indecisive).

From TA prospective, Bear is out of steam is confirmed with last weekly chart. The week volume is closed with a positive Green Volume (Above 50D average) and stabilizing. These signs increase the probability of a Good Entry for Stocks or Value Hunting.

Using TA Stocks Screener - For Good stocks tend to be in Side or Up Trend.
Using FA Stocks Screener - Selection of Value stocks - you can used the Stocks Screeners (as your selection). FA Stocks Screener - Choose those with either Green PE trailing or discounted NAV.