


TA for STI
- Trend - DownTrend
- Momentum - Oversold
- Support - 2720
- Resistance - 2780
- Candlestick - Doji (indecisive)
- Volume - 0.5x
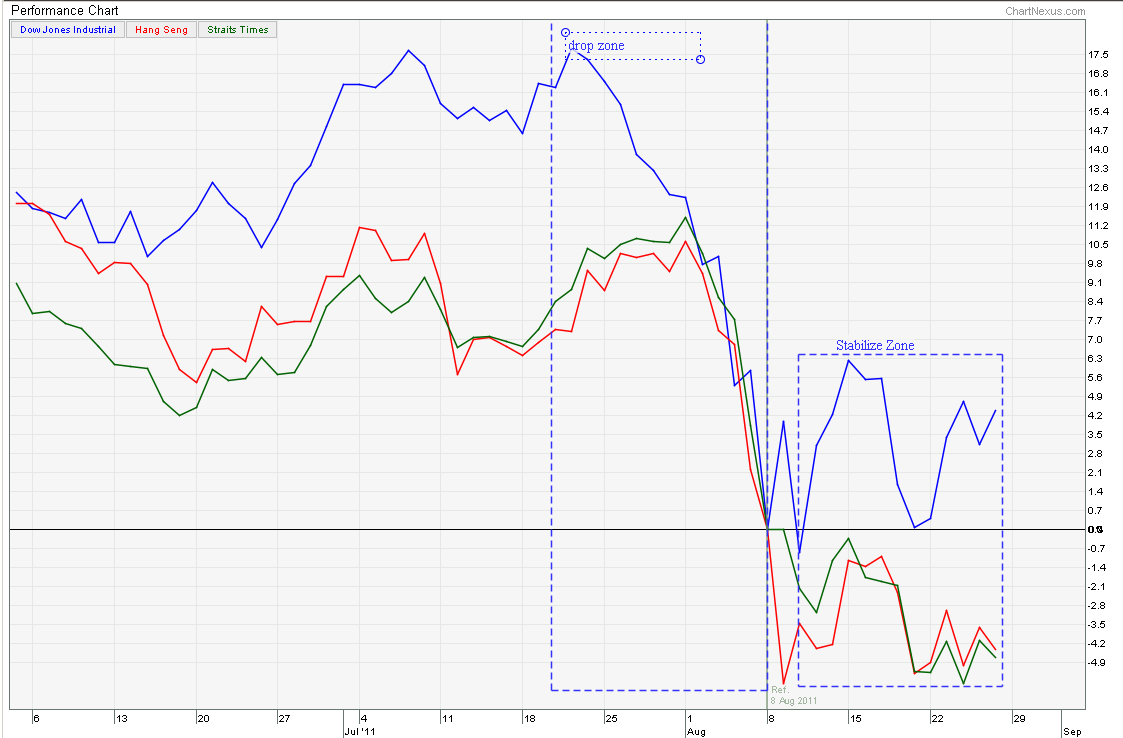
An excessive selling will drain the Bear energy, and now we are in the stabilize zone. From the daily STI index, we are in the narrow range of 2720 and 2780. Each Candlestick tends to cancel off each other, making trading volatility high and unpredictable (eg, Black Engulfing (Bear)-> White Harami (Bull) -> Doji (Indecisive).
From TA prospective, Bear is out of steam is confirmed with last weekly chart. The week volume is closed with a positive Green Volume (Above 50D average) and stabilizing. These signs increase the probability of a Good Entry for Stocks or Value Hunting.
Using TA Stocks Screener - For Good stocks tend to be in Side or Up Trend.
Using FA Stocks Screener - Selection of Value stocks - you can used the Stocks Screeners (as your selection). FA Stocks Screener - Choose those with either Green PE trailing or discounted NAV.
No comments:
Post a Comment