DJI aggressive bullish with high volume, broke 4 Moving Average within 1 day and downward channel. Trading range is now at 12,200 and 11,200.
STI upward movement was mild, just manage to break above 50D MA. But it is a gap-up doji candle, it is like an indecisive candle. The trading range is now at 2890 and 2646.

Dear viewers, I am moving from blogspot "ckhpaul.com" platform to another membership platform known as "Geckochart.com". It's free as promised - if you like this blog. Do follow me to the new site, as I will be featuring more screeners and SGX announcement to ensure that we made little money for our investment. Please registered as FREE "Regular Member", to see more information or SGX/HSI/Currency screeners.
Menu
WE HAVE MOVED TO GECKOCHART.COM (Join us there, It's FREE)
WE HAD MOVED TO GECKOCHART.COM. IN 2012, YOU WILL SEE MORE ADVANCE SIGNALS AT THE BLOG SITE
LIVE Chat - Stocks Signal Tips Board
1/12/11
27/11/11
Nov 28, TA for STI, DJI
Nov 28, TA for DJI,
Nov 28, TA for STI,
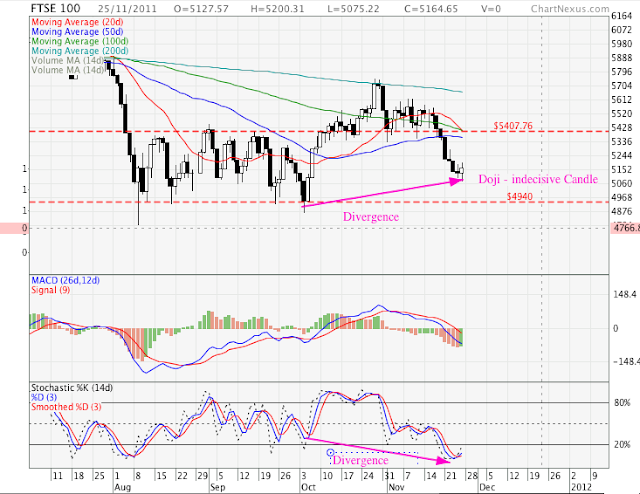
Nov 28, TA for FTSE,
Performance chart for major indexes, the green dotted box indicates the past support and resistance line. Major indexes are retesting the old support. USD Index is backed to strong support. HSI is the worst performance index.
- Trend - Down (DJI trend below 50D MA)
- Momentum - Oversold. (sign of Divergence)
- Volume - Low (sign of reversal)
- Candle - Inverted hammer (weak bullish signal)
- Support - 10,650
- Resistance - 11,370
- Pattern - Downward slope
Nov 28, TA for STI,
- Trend - Down (STI trend below 20D,50D MA)
- Momentum - Oversold.
- Volume - Average
- Candle - Black Marubozu
- Support - 2670 (We are at any critical support, if broken, we are definitely heading toward 2500)
- Resistance - 2750
- Pattern - Downward slope (like a falling knife)
Nov 28, TA for FTSE,
- Trend - Down
- Momentum - Oversold. (sign of Divergence)
- Candle - Doji (indecisive)
- Support - 4940
- Resistance - 5400
- Pattern - Downward slope
Performance chart for major indexes, the green dotted box indicates the past support and resistance line. Major indexes are retesting the old support. USD Index is backed to strong support. HSI is the worst performance index.
Subscribe to:
Comments (Atom)


