Menu

WE HAVE MOVED TO GECKOCHART.COM (Join us there, It's FREE)

WE HAD MOVED TO GECKOCHART.COM. IN 2012, YOU WILL SEE MORE ADVANCE SIGNALS AT THE BLOG SITE

LIVE Chat - Stocks Signal Tips Board

25/12/11

Dec 25, TA for STI, HSI and DJI


Dec 25, TA for STI
  • Trend - Down
  • Momentum - Upward swing from Oversold
  • Support - 2640
  • Resistance - 2780
  • Candle - Doji
  • Volume - 0.5x (festive mood)


Dec 25, TA for HSI
  • Trend - Down
  • Momentum - Moderate upward swing
  • Support - 17980
  • Resistance - 19200
  • Candle - Doji
  • Volume - 0.5x (festive mood)


Dec 25, TA for DJI
  • Trend - Up (bullish)
  • Momentum - Overbought
  • Support - 11,700
  • Resistance - 12,200
  • Candle - White Soldier (bullish)
  • Volume - 0.5x (festive mood)
  • Pattern - Ascending Triangle (bullish)

For DJI, one thing to note is that it had attempted to break a long resistance level at 12,200. Market might be moving up cautious for DJI.

22/12/11

Dec 22, TA for STI

Dec 22, TA for STI

  • Trend - Down
  • Momentum - Oversold
  • Candlestick - Gapup
  • Volume - 0.5x
  • Support - 2620
  • Resistance - 2780 or 2700 (20D MA)

17/12/11

Dec 19, TA for STI, DJI and HSI


Dec 19, TA for STI

  • Trend - Down (Range-bound trading)
  • Momentum - Oversold
  • Support - 2640
  • Resistance - 2780
  • Volume - Low
  • Candlestick - NA

STI had broken the symmetrical pattern and forming a range bound trading pattern. With decreasing volume and a price down, it is showing sign of bullish reversal.

 Dec 19, TA for DJI

  • Trend - Up
  • Momentum - Moderate downward momentum
  • Support - 11,800
  • Resistance - 12,200
  • Volume - 1.5x 
  • Candlestick - NA
Last week, DJI was resisting at 12,200 unable to break through it. Index is now sitting tightly at 11,800 (above 20D MA and 50D MA) indicating a bullish. The ascending triangle formation still intact. 


Dec 19, TA for HSI

  • Trend - Down (into a narrow bound range or symmetrical formation)
  • Momentum - toward Oversold
  • Support - 17,500
  • Resistance - 19,200
  • Volume - 1x
  • Candlestick - NA
As mentioned in the last blog, HSI is still in symmetrical formation, such formation is a bullish reversal which also indicates trading range is tight and narrow - needs to see a breakout for a clear direction. 

11/12/11

Dec 12, TA for STI, HSI and DJI

Dec 12, TA for STI,
  • Trend - Side
  • Momentum - Moderate 
  • Support - 2640
  • Resistance - 2770
  • Volume - Low
  • Candle - GapDown with Doji (Indecisive)
  • Pattern - Symmetrical Triangle (Bullish)
Last week, STI was resisting at 2770 and then a pullback to 2700 (indecisive candle). Volume was low for the past few days and 28D pattern was forming a symmetrical triangle. 


Dec 12, TA for DJI,
  • Trend - Up (Above all MAs - Bullish)
  • Momentum - Overbought
  • Support - 11,220
  • Resistance - 12,200
  • Volume - Average
  • Candle - Counter-attack (indecisive)
  • Pattern - Ascending Triangle (bullish)


Dec 12, TA for HSI,
  • Trend - Side
  • Momentum - Overbought
  • Support - 17,540
  • Resistance - 19,200
  • Volume - Low
  • Candle - Gap Down
  • Pattern - Ascending Triangle (bullish)


7/12/11

Dec 7, TA for STI


STI is still resisting at the 2770, sitting nicely on 50D and 20D. Take note of the low trading volume.

4/12/11

Dec 5, TA for DJI


Trend - Up
Momentum - Near Overbought
Resistance - 12200 (DJI now at resistance)
Support - 11200
Candle - doji + shooting star 
Volume - Average.

Last week, the recovery of the DJI was impressive. Things to observe was the insider news about the co-ordinated banks bailout occurred on last Wednesday, but on 25 Nov, the volume just disappear into half. This was a very usual volume especially for DJI, and such signal always indicated some form of bullish reversal - "Price down with low volume". However, DJI index is now trading at the past resistance level. Breaking through needs some strong economic data, else index should be trading momentously down.

Dec 5, TA for STI

Trend - Side
Momentum - Moderate
Support - 2640
Resistance - 2900
Volume - Half
Candle - hanging man (bearish reversal)

STI is at the trading range of 2900 and 2640, volume at half indicate poor momentum and Hanging man candle shown bearish reversal. 100D MA (2830) is to be watched as it co-exist with past resistance, STI had not been able to break the 100D MA.

1/12/11

Dec 1, TA for STI and DJI

DJI aggressive bullish with high volume, broke 4 Moving Average within 1 day and downward channel. Trading range is now at 12,200 and 11,200.


STI upward movement was mild, just manage to break above 50D MA. But it is a gap-up doji candle, it is like an indecisive candle. The trading range is now at 2890 and 2646.

27/11/11

Nov 28, TA for STI, DJI

 Nov 28, TA for DJI,

  • Trend - Down (DJI trend below 50D MA)
  • Momentum - Oversold. (sign of Divergence) 
  • Volume - Low (sign of reversal) 
  • Candle - Inverted hammer (weak bullish signal)
  • Support - 10,650
  • Resistance - 11,370
  • Pattern - Downward slope


Nov 28, TA for STI,

  • Trend - Down (STI trend below 20D,50D MA)
  • Momentum - Oversold. 
  • Volume - Average
  • Candle - Black Marubozu
  • Support - 2670 (We are at any critical support, if broken, we are definitely heading toward 2500)
  • Resistance - 2750
  • Pattern - Downward slope (like a falling knife)


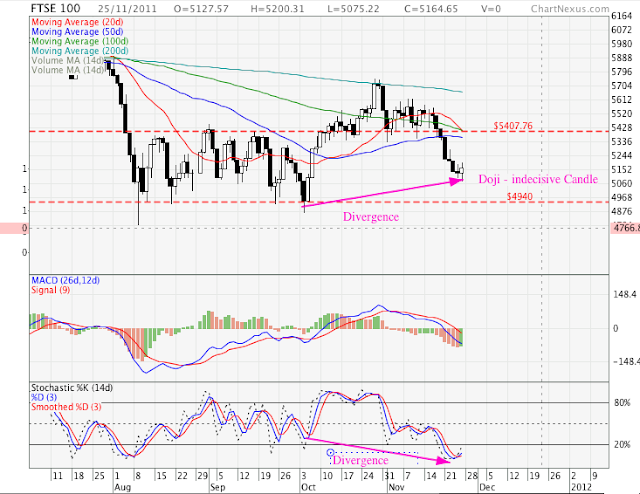
 Nov 28, TA for FTSE,

  • Trend - Down 
  • Momentum - Oversold. (sign of Divergence) 
  • Candle - Doji (indecisive)
  • Support - 4940
  • Resistance - 5400
  • Pattern - Downward slope

Performance chart for major indexes, the green dotted box indicates the past support and resistance line. Major indexes are retesting the old support. USD Index is backed to strong support. HSI is the worst performance index.

24/11/11

Nov 24, TA for STI and DJI

Nov 24, TA for DJI,

TA for DJI, we should be officially into the trading range of 11600 and 10800. DJI had trend below the 50D MA, indicating a start of downtrending.


Nov 24, TA for STI,

STI is trading at a strong support 2680, to short at a STI strong support is dangerous. STI needs to trade down for a strong confirmation of downtrending or a better chance to do a short position. Volume has picked up over the last few days, indicating Bear is gaining momentum.

20/11/11

Nov 21, Weekly TA for STI (using Fibonacci methods)


Recently, STI movement was bullish testing the 2900 and a quick 3 weeks reversal back to 2700 support level. The Europe debts news are constantly causing the volatility and the index swing. The daily trades are confusing but STI daily movement is getting bearish with increased volume.

A quick update of the Fibonacci Retracement and Timezone to determine the overall predictive model. In this chart, I have updated 3 colors arrows (RED = Fibonacci, BLUE = Historical Support/Resistance, ORANGE= 28Days Support and Resistance). Fibonacci Timezone was incorporated to estimate a possible movement of a new trading Range.

Based on the reading of the Fibonacci's Retracement and Timezone, this trading range will still persist for a period of time. Critical STI support range to watch - 2680 and 2580.

Safe Trading.  

19/11/11

Nov 21, TA for STI and DJI


  • Trend - Side to Upward (above 100D support and below 200D resistance)
  • Momentum - Moderate downward
  • Support -  11600
  • Resistance - 12200
  • Candle - Harami (bullish Reversal)
  • Volume - 14D Average below 50D Average, Daily below 14D Average (indicate cautious volume)
  • Pattern - 14D -> Downward Slope detected. 


  • Trend - Side to Down ( trade below 20D and 50D MA) - (bearish)
  • Momentum - near Oversold
  • Support - 2687
  • Resistance - 2900
  • Candle - Gap Down with black Marubozu (bearish)
  • Volume - slight volatility detected, 14D above 50D. Price down with increase momentum (bearish momentum persists.)

In general, STI is more bearish as compared to DJI index. STI had traded below the 2760 support or below the 50D MA with increased selling momentum (bearish momentum persist). Short term 21D downward slope formation. STI important index to watch 2680 ( a strong historical support), it will determine the next trade range.

18/11/11

Nov 18, TA for SIA


SIA has been in upward momentum for months. After the announcement of the drop in load factor, it started to break the new 14D support or trading out of the upward channel. Major Support for SIA is at 10.34.

13/11/11


Nov 14, TA for STI,

  • Trend - Side
  • Momentum - Moderate
  • Support - 2757
  • Resistance - 2900 or 100D MA 
  • Candlestick - Doji
  • Volume - 1.3x


Nov 14, TA for DJI,

Trend - Up (along and above 200D MA)
Momentum - Moderate
Support - 11600
Resistance - 12200
Candlestick - white marubozu
Pattern - Upward Slope
Volume - 0.8x


The green box represents the major indexes range trading boundary. So far, DJI and US Index are trading above the box range. The major indexes (Eg, FTSE, STI, Silver) are resisting along each resistance level. Again, HSI is the worst performing index and still near the support level of the range.

9/11/11

Nov 9, TA for DJI


DJI is range bound between 12200 and 11600. Overall indicators are still in bullish with long term signal at upward channel. Be cautious on your trading.

5/11/11

DJI wave formation


Where is the DJI heading?

To recap the Wave A formation when the index plunged on Aug 2011. Such movement signals a possibility a trend reversal. However, the Wave Formation needs a long period of signal to prove its usefulness. As a reference, Fibonacci Retracement (dotted blue line) is used to guide the macro-movement of the index.  During a main wave movement (blue and red continuous lines), those lines are another measurement to gauge the probability of the formation. Now, you can see that DJI is trading above the blue line (11800). For a proper wave B formation, this is the resistance level. But trading above might violate the wave B line, it probability looks like a Wave 4 (instead of Wave A) or Wave 5 (instead of Wave B).

Ignoring the wave theory, the TA is definitely bullish when it is above 11,800 and it is a typical "Resistance turn Support" strategy and probability heading toward 12,800.

Nov 7, TA for STI


  • Trend - Side
  • Momentum - Average
  • Support 1 - 2760 
  • Support 2 - 2700 
  • Resistance - 2880
  • Candlestick - Gap up shooting star (short term bullish but with shooting star reversal) 
  • Volume - >50D MA
  • Pattern - Upward Slope, with higher Highs and Higher Lows (long term is bullish)

STI is now trading in Side Range o f 2700 and 2900, overall TA signals are bullish. STI index to watch is 2880 which is aligned with 100D MA. If STI breaks through resistance and 100DMA, it will enter into a new range of 2880 and 3000.

1/11/11

Nov 2, TA for STI

Trend - Side
Momentum - Overbought
Candle - 2 black crows
Volume - Average
Pattern - Upward Slope

2 white soldiers + 2 black crows = ZERO. When the STI broke 2700 and the march toward 2900 with 2 white soldiers with strong volume are positive signs. The only resistance to clear is the 100D MA, if it can break it, it should march higher high. In fact, with the strong volume, I do expect some form of slight pullback for a higher LOW signal for a re-buy. Unfortunately, the 2 black crows appeared and now signal is side trading into 2900 and 2700. STI to watch is 2750 (50D MA) and as long as STI don't bleach 2700. It is still a upward momentum.

30/10/11

Oct 31, TA for STI

Trend - Side (resisting at 100D MA)
Momentum - Overbought
Volume - 2x 50D MA
Candle - NA
Pattern - NA

In my last week forecast, the STI should be targeting 2880. With 2 strong days of momentum, It had broken the Resistance and turn support. Another very bullish signal. The new trading range is now at 2880 and 3000. What to watch for next week STI? 100D MA 2900. 2x volume advancement observation are not so common, and if it arrives - it is indicating institutions buying in. Those STI 2700 and 2500 should remain a history. Should I buy now? Likely momentum is targeting 3000 and most likely 3200.

28/10/11

Oct 28, TA for STI


STI is now trading at the new resistance of 2882. The new trading range is 2882 and 2700.

23/10/11

Oct 24, TA for Global Indices


DJI is trending above 100D MA, broke the downward slope, testing the resistance leve and finally 20D MA testing the 50D MA, a nice combination of a bullish sign.

 FTSE had broken the 5400 resistance, and marginally trending above the 5400 level. It seems like a resistance turn support. It trending above the 50D and resisting the 100D MA. The MACD is above the 0 level and histogram 4R1G (bullish reversal). Overall, the technical signals are positive for LONG.


Let's look at the overall performance chart indices, the best performing index is the DJI breaking resistance and the worst performing index is the HSI.  The USD index is retreating the gain, as DJI gaining upward momentum. One thing to note is the Gold is stabilising or remains relative flat.

22/10/11


Trend - Downward (but support at 20D MA, possibility into Side Trend)
Momentum - Overbought
Support - 17800
Resistance - 18800
Candle - NA
Volume - Low

For HSI, the index should be stabilizing with low volume movement. It is now supported by 20D MA, but it needs to break through the 28D downward channel or break the 50D MA. From the various signals, HSI will likely to trend upward toward the 18800 resistance.


  • Trend - Side 
  • Momentum - Oversold
  • Support - 2700
  • Fibonacci Resistance - 2882
  • 14D Resistance - 2780 (aligned with 50D MA resistance)
  • Candle - harami (neutral)
  • Volume - 0.5x of average
  • Pattern - broke 28D downward channel

From the last 2 weeks, we can observe that the trading range has changed. It is now side trading within the target range of 2700 and 2880. This range is a bullish range as compared to  2520-2700 bearish range.

One of the bullish signs that we can observed is that volume decreasing (14D MA Vol is below 50D MA Vol) and price is stabilising or support at 2700.  Short term trading range is 2700 and 2880.


From the weekly chart, it shown black upward candle with reducing volume. Such signal doesn't any sign of bullishness. Signal is trending along long term MA. Another contradicting signal against the daily chart movement.

17/10/11

SIA Q3 performance report

TA/FA for NOL


NOL Q3 performance report - FEU and Monthly Price are stabilising. A good sign for entry.

16/10/11

TA/FA for LKH

Simple FA for LKH,

PE - 2.7x (EPS - 0.11) - Low PE.
NAV -0.45 (35% discounted NAV)
Yield - 10% or 0.04 cents (Good Yield) - but already payout in 23June 2011.

LKH is a property and construction company. From financial ratio analysis prospective, it pretty much shown value investing. It's a good company to consider for long term.

FA - Profit and Loss for LKH, Yearly q to q, it's a -63% for revenue and -38 for Profit.


From Balance Sheet Analysis,

1. Total Asset increment by +90%. (Good sign as NAV will increment)
2. Total Liabilities increment by +240%. (a negative sign - need to know why borrowing is done?)
3. Cash Flow decreased by -79% to 33 millions. (need to know how money is being spend?)


Why are the losses?


 Why and how much is the borrowings being done?

** Borrowings exceeded Cash flow - ( Poor Cash Flow management). 

How are they continue to make more money?
The new revenue outlook for LKH is poor with almost all the business units are under performing


Conclusion,


The financial ratio entry is good with good yielding. However, the outlook for the company is poor. It has poor Cash flow management. In the event of global economic recession, where almost all property sectors are affected and poor Cash flow position. 
The risk is high for long term position. Moreover, it has history of paying dividend once a year (23 June 2011), which we have missed the payout. I would say meanwhile, you can put your money elsewhere until you re-visit them by the end of the year.